Study Results for 2D Subset-DIC
If you have just run a Subset DIC analysis (as described in Make and Run 2D Subset-DIC Input File), you will see the DIC input file under the DIC node in the Workspace Tree.
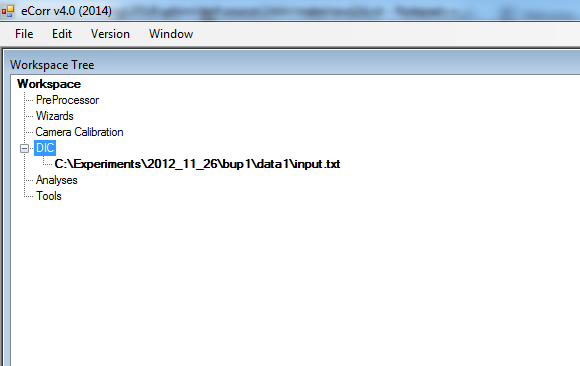
If you have run the DIC analysis in a previous session, you can load the input file by right-clicking the “DIC” node in the Workspace Tree and choose “Load Input File...”. The input file will then appear as the image above.
Right-click the on the input file in the Workspace Tree, and choose “Results View (image)” in the context menu.
The Results View (Image) will appear as shown below. The results viewer is linked to the specified input file. It is possible to open multiple result viewers for different input files.
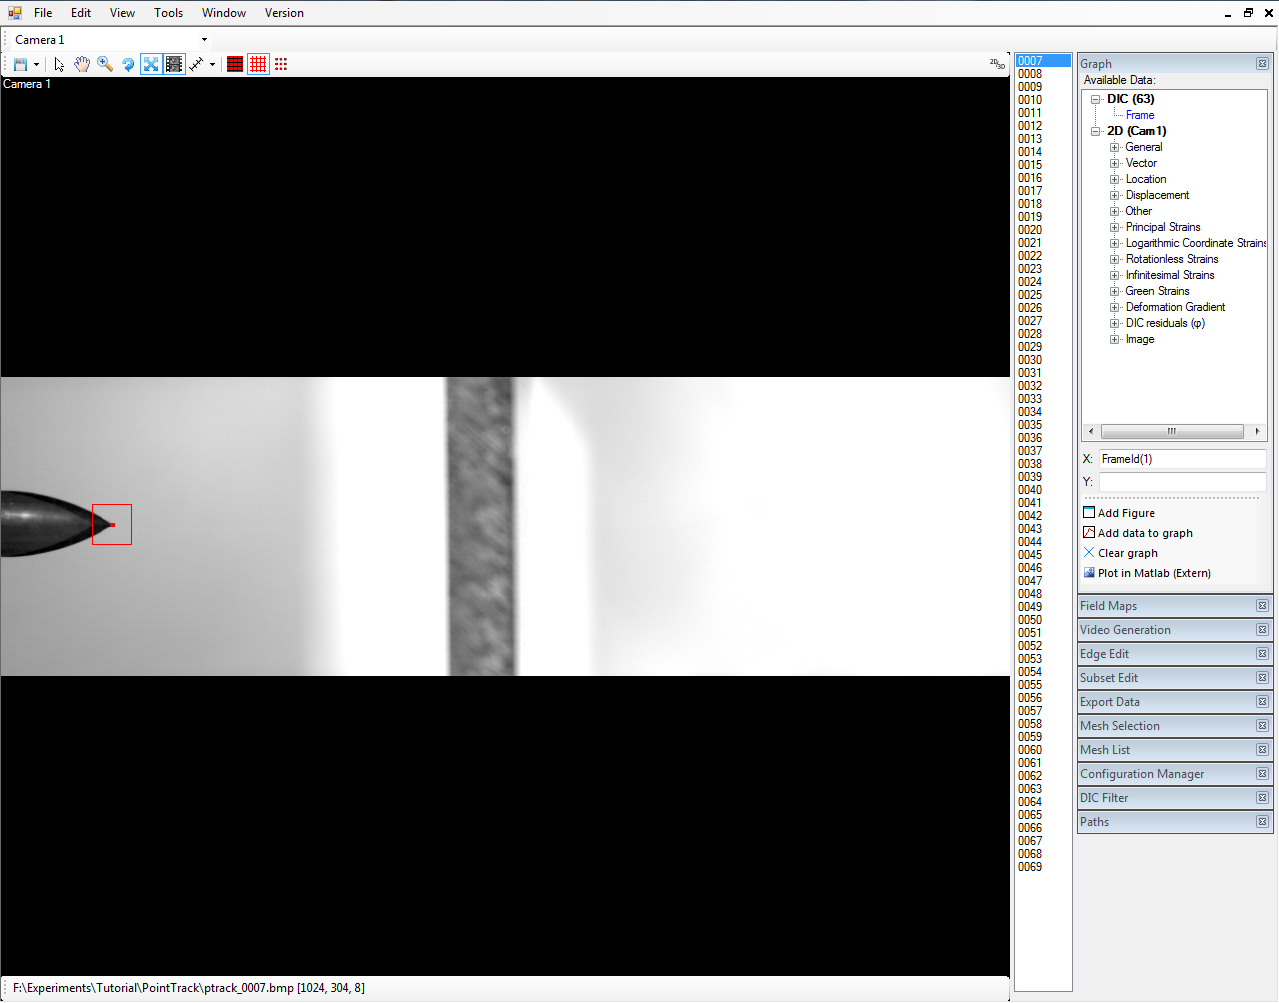
In the listbox to the right in the Results View (Image) , all the images in the DIC analysis are listed. You can decide which image to study by clicking in this list. By scrolling through the images in the list, you will see how the subset(s) has evolved from image to image.
The main features in the post-processing of the Subset DIC analysis is:
- Plot data in figures
- Exporting data to text files
Plotting data in figures
- In the Results View (Image), open the Graph Tool and the Subset Tool
- In the Subset Tool, choose Select Subset
- With the “Select subsets”-action active, click on the subsets that you want to plot data from. The selected subsets are indicated with a different color, and a color fill.
Now, the Graph Tool can be used to plot the data of choice for the selected subset(s) in figures.
The available data for a subset, are mainly initial locations and displacements. And in the case of a 2D analysis, this is restricted to two-dimensional locations and displacements in the image plane.
Hint
A mm-per-pixel scaling factor can be added to the input file, in order to plot data in millimetres insted of pixels.
Hint
Using the Mesh Select Tool and Select Vectors, it is possible to define vectors between subsets. Hold down “CTRL” when defining a vector, to lock the vector to the subset center. The elongation of these vectors can be plotted in the same way as for a standard DIC analysis.
Exporting data to text files
The exportion of data to text files is done using the Export Data Tool in the same way as for a standard DIC analysis. Right-click on the data type you want to add to the text file, and click Add Data to List. The data type is added to the list below. When you have added all the data you want to be written to the text file, click Write data to text file....
Subsets and/or vectors are selected as described above int the Plotting data in figures-section.